— iIT-Services

Archive
Tag "Graph"

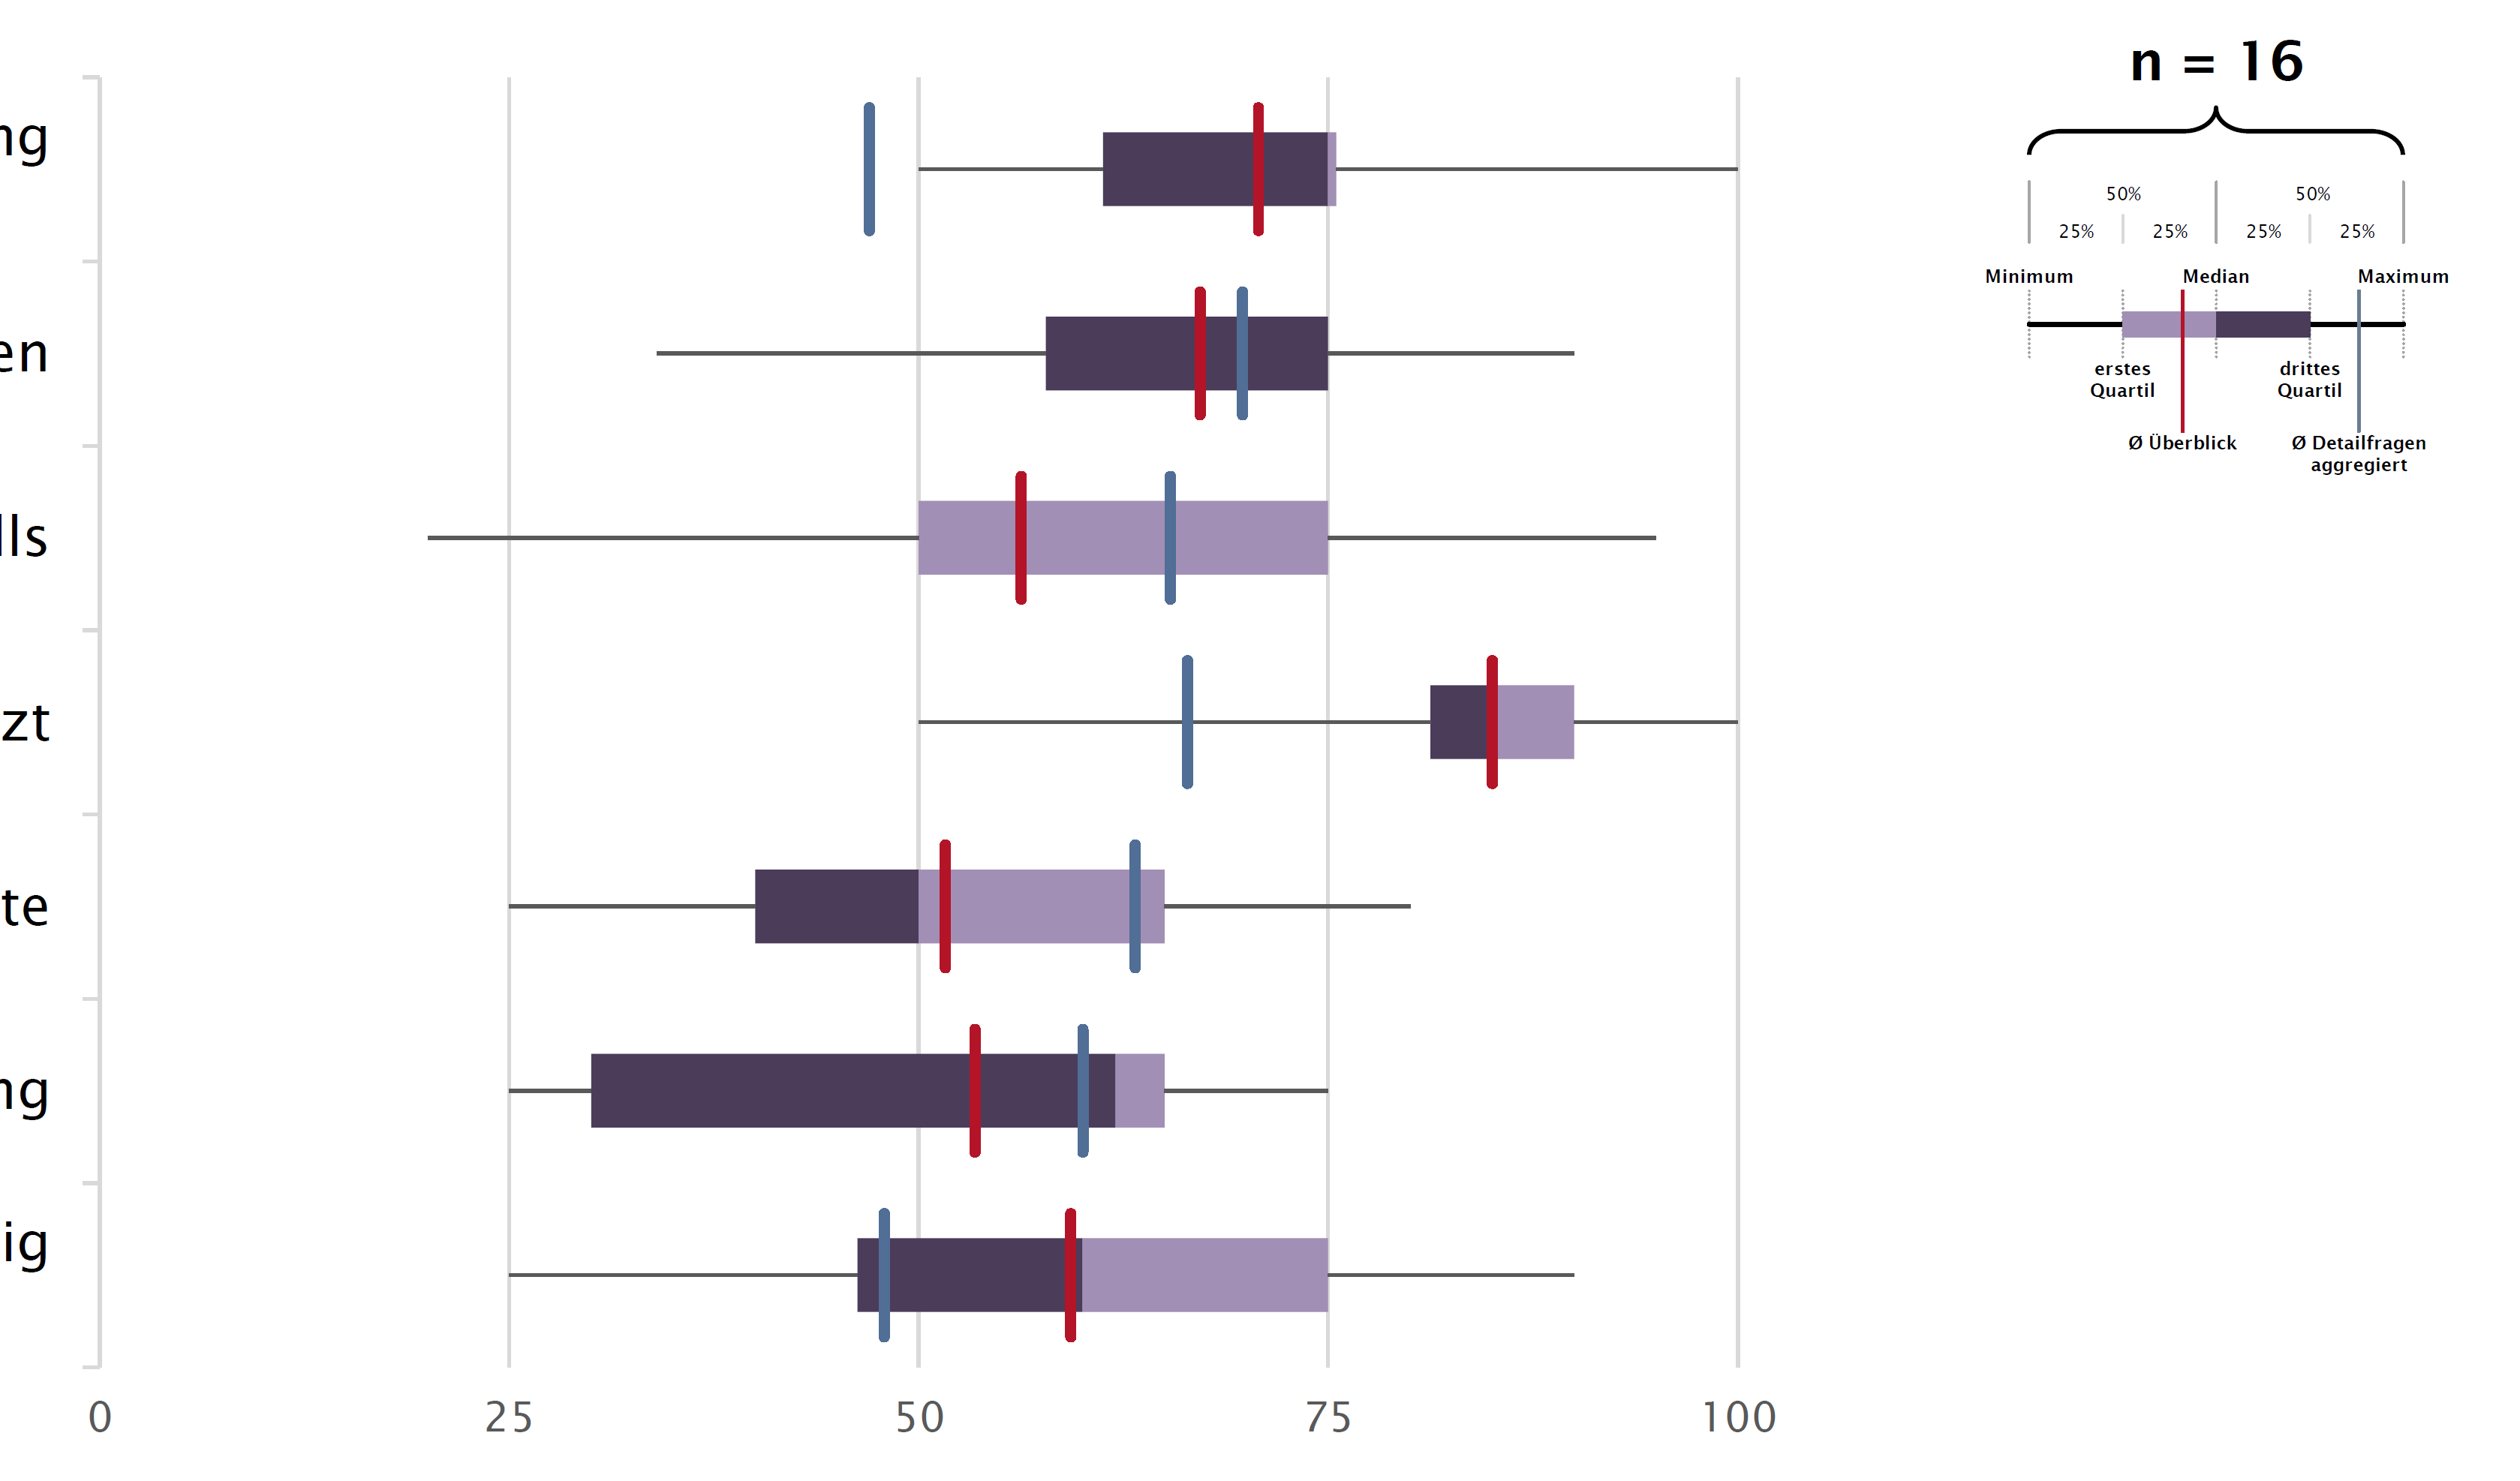
I was wondering, how can I add vertical line metrics to a horizontal bar chart or box-plot in Excel, as for example shown below in a box plot.

This is explained, step-by-step, in the tutorial that can be found here: https://www.exceldashboardtemplates.com/step-by-step-horizontal-bar-chart-with-vertical-lines-tutorial/.

Read More

Gephi is an interactive visualization and exploration platform for all kinds of networks and complex systems, dynamic and hierarchical graphs.
Runs on Windows, Linux and Mac OS X. Gephi is open-source and free: http://gephi.org.

Read More

NodeXL is a free, open-source template for Microsoft® Excel® 2007, 2010 and 2013 that makes it easy to explore network graphs.  With NodeXL, you can enter a network edge list in a worksheet, click a button and see your graph, all in the familiar environment of the Excel window.

Website: http://nodexl.codeplex.com.

Read More