— iIT-Services

Archive
Tag "Excel"

As written a while ago already, password-protected Excel worksheets can be unlocked through a VBA script:

Even simpler is the approach through editing the XML source of the Excel file, as described by paracon.ca/…:

  1. Rename your file by adding *.zip to its extension.
  2. Open the zip file.
  3. Browse to the path ‘xl > worksheets’ folder.
  4. Extract the protected sheet xml file to local drive.
  5. Open the xml and delete the markup text <sheetProtection …>.
  6. Save and close the xml file.
  7. Overwrite the original xml in the zip folder with the file from local drive.
  8. Close the zip file and rename the file by removing the .zip extension.
Read More

I recently tried to have the custom date format in MS Excel

DDD DD.M., as of Mon 24.5. formatted on two lines in a single cell. That is, as:

Mon
24.5.

Aesthetisc of MS Office required me to implement this through formatting, instead of, e.g., using two cells with different formulas.

The solution was to use special characters, i.e., the line break character. Here, we’re talking about “ALT Keyboard Sequences”. Meaning: press and hold the ALT key while typing a sequence of numbers. For a line break, the sequence is “0010” or just “10”.

For the challenge above, in Excel, that meant typing DDD, then the ALT-sequence, and finally the DD.M. into the custom cell format. Interestingly enough, Excel makes a line break without showing the second (and further) line(s), but perfectly working as format.

The key sequences for any speical character can be found for example on https://tools.oratory.com/altcodes.html (EN) or also http://www.sonderzeichen.de/sonderzeichen_mit_alt.html (DE).

Read More
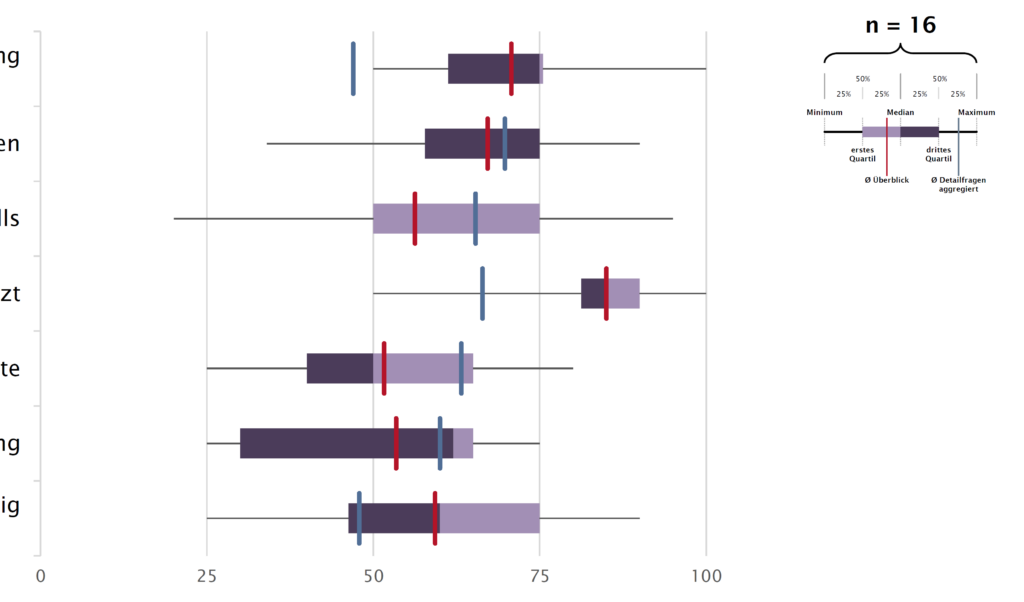
I was wondering, how can I add vertical line metrics to a horizontal bar chart or box-plot in Excel, as for example shown below in a box plot.

This is explained, step-by-step, in the tutorial that can be found here: https://www.exceldashboardtemplates.com/step-by-step-horizontal-bar-chart-with-vertical-lines-tutorial/.

Read More

A Butterfly chart is a chart where two entities are compared side by side using scales meeting at the center. Due to its shape, the chart resembles a butterfly and hence the name. These charts are sometimes also known as Funnel or Tornado Charts though I find “butterfly” to be a better description as it allows for a greater variation in shape than a funnel or a tornado does: http://www.databison.com/butterfly-chart-excel-chart-with-dual-converging-scales/.

Read More

Protecting MS Excel Worksheets with passwords can be user-friendly. No one fiddles with the configuration. Yet, if you need to administer the sheets, lost passwords are a pain. So, in case you need to unprotect a sheet – and obviously only if you have the right to do so! – the following VBA code snippet can help:

Sub LittleMagicPasswordBreaker()
    Dim i As Integer, j As Integer, k As Integer
    Dim l As Integer, m As Integer, n As Integer
    Dim i1 As Integer, i2 As Integer, i3 As Integer
    Dim i4 As Integer, i5 As Integer, i6 As Integer
    
    On Error Resume Next
    For i = 65 To 66: For j = 65 To 66: For k = 65 To 66
    For l = 65 To 66: For m = 65 To 66: For i1 = 65 To 66
    For i2 = 65 To 66: For i3 = 65 To 66: For i4 = 65 To 66
    For i5 = 65 To 66: For i6 = 65 To 66: For n = 32 To 126
    
    ActiveSheet.Unprotect Chr(i) & Chr(j) & Chr(k) _
        & Chr(l) & Chr(m) & Chr(i1) & Chr(i2) & Chr(i3) & _
        Chr(i4) & Chr(i5) & Chr(i6) & Chr(n)
    If ActiveSheet.ProtectContents = False Then
        MsgBox "One usable password is " & Chr(i) & Chr(j) & _
            Chr(k) & Chr(l) & Chr(m) & Chr(i1) & Chr(i2) & _
            Chr(i3) & Chr(i4) & Chr(i5) & Chr(i6) & Chr(n)
        Exit Sub
    End If
    Next: Next: Next: Next: Next: Next
    Next: Next: Next: Next: Next: Next
End Sub

 
Just open the VBA editor ([Alt]+[F11]), copy the snippet into a new VBA Module of the Excel worksheet, and execute (Run or [F5]).

Credits to: https://www.iseepassword.com/crack-ms-excel-password.html#part1

Read More

NodeXL is a free, open-source template for Microsoft® Excel® 2007, 2010 and 2013 that makes it easy to explore network graphs.  With NodeXL, you can enter a network edge list in a worksheet, click a button and see your graph, all in the familiar environment of the Excel window.

Website: http://nodexl.codeplex.com.

Read More